Computing Research News
May 2010 Vol. 22/No. 3
Undergraduate CS Enrollment Continues Rising; Doctoral Production Drops
2008-2009 Taulbee Survey
By Stuart Zweben
The CRA Taulbee Survey1 is conducted annually by the Computing Research Association to document trends in student enrollment, degree production, employment of graduates, and faculty salaries in Ph.D.-granting departments of computer science (CS),computer engineering (CE) and information (I)2 in the United States and Canada. This article and the accompanying figures and tables present the results of the 39th annual CRA Taulbee Survey.
Information is gathered during the fall. Responses received by January 5, 2010 are included in the analysis. The period covered by the data varies from table to table. Degree production and enrollment (Ph.D., Master's, and Bachelor's) refer to the previous academic year (2008-09). Data for new students in all categories refer to the current academic year (2009-10). Projected student production and information on faculty salaries and demographics also refer to the current academic year. Faculty salaries are those effective January 1, 2010.
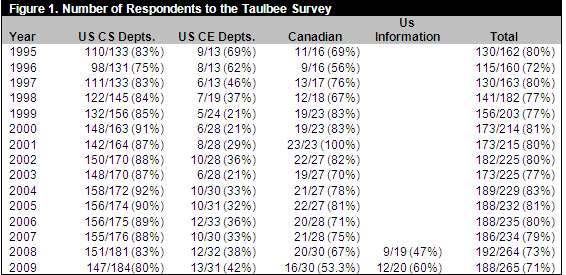
We surveyed a total of 265 Ph.D.-granting departments. Included in this count are twenty I-school departments, which we began surveying a year ago. Of the 265 departments surveyed, 188 returned their survey forms, for a response rate of 71%. This is down from last year’s 73%, but is still quite comprehensive (see Figure 1) and is negatively influenced by the response rates of 60% and 53% from the I departments and Canadian departments, respectively, as well as the typical low response rate (40%) from CE programs. We had a good response rate from U.S. CS departments (147 of 184, or 80%), although it was lower than last year’s 83% response for this group.3
This year’s report includes information about teaching loads, space, support staff, graduate student recruiting methods, and sources of research funding. These questions are added to the survey every third year because the data in these areas change slowly.
Departments that responded to the survey were sent preliminary results about faculty salaries in December 2009; these results included additional distributional information not contained in this report. The CRA Board views this as a benefit of participating in the survey.
We thank all respondents who completed this year's questionnaire. Departments that participated are listed at the end of this article.
Ph.D. Degree Production, Enrollments and Employment (Tables 1-8)
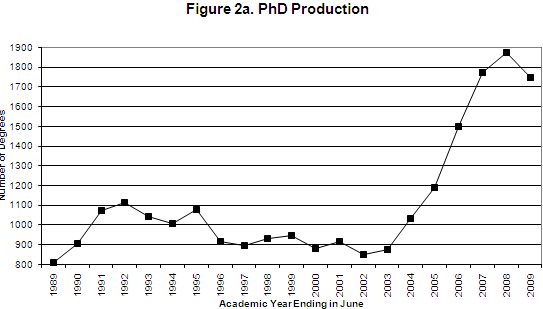
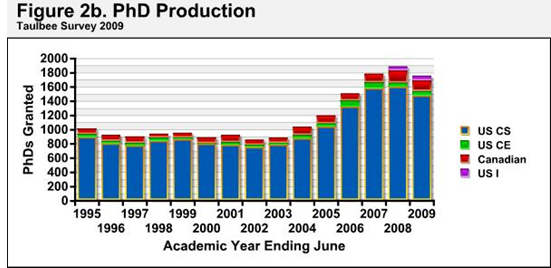
For the first time since 2001-02, total Ph.D. production among the responding departments declined last year. For the period between July 2008 and June 2009 production was 1,747 (Table 1), a 6.9% decrease from last year. If the I degrees are eliminated from consideration, the decline is 8.3%, and if computer science Ph.D.s only are considered, the decline is 7.8% (see Tables 2 and 3).
A decline was predicted in earlier Taulbee Survey reports. However, economic conditions may have exacerbated the extent of the current decline, as some students choose to take longer to graduate when the job market is weak. There also were fewer departments reporting this year, but those who did not tended to be departments with small numbers of doctoral graduates.
This year’s production of 1,747 is well below the 2,107 predicted last year. The “optimism ratio,” defined as the actual number divided by the predicted number, was 0.83, much worse than last year’s 0.90. Departments notoriously over-predict the number of Ph.D. graduates. Next year, they predict 2,009 graduates, fewer than they predicted last year. While normally we should expect to see a continued decline in the production during 2009-10, the delayed graduations this past year will affect next year’s results.
The number of new students passing thesis candidacy exams (most, but not all, departments have such exams) rose only 1% this year. When the I departments are subtracted, there was no longer an increase. The overall number of students passing the qualifier dropped slightly more than 3%. Without I departments, the decrease was slightly over 4%.
The total number of new Ph.D. students overall (Table 5) is about the same as last year, following a 10% increase reported last year. On a per-department basis, the numbers also held steady, as was the case last year. If only computer science doctoral students are considered, there is a slight decline, but that is due to the decline from Canadian schools, whose data are more volatile due to the relatively small number of departments reporting.
Figure 3 shows a graphical view of the pipeline for computer science programs. The data in this graph are normalized by the number of departments reporting. The graph offsets the qualifier data by one year from the data for new students, and offsets the graduation data by five years from the data for new students. These data have been useful in estimating the timing of changes in production rates, including this year’s decline.
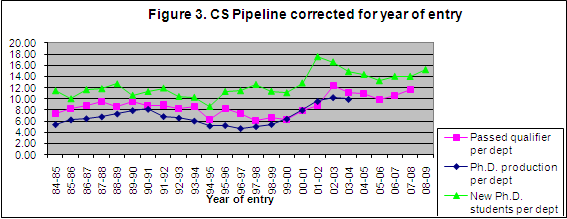
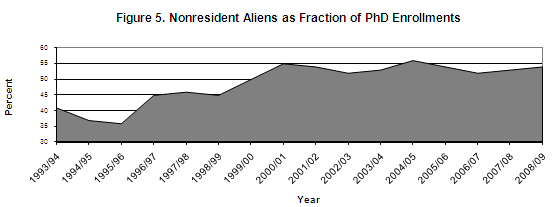
Table 5a reports the data for new students in fall 2009 from outside North America. U.S. computer science departments have a larger percentage of new students from outside North America this year than they did last year (60.3% vs. 55.6% last year). When all departments are considered, the increase was to 59.1% this year from 54.0% last year and 54.8% the previous year.
Figure 4 shows the employment trend of new Ph.D.s in academia and industry, and the proportion of those going to academia who took positions in departments other than Ph.D.-granting CS/CE departments. Table 4 shows a more detailed breakdown of the employment data for new Ph.D.s. Largely due to economic conditions, there was a noticeable shift in the sector of employment for 2008-09 graduates. Whereas 56.6% of 2007-08 doctoral graduates went into industry, only 47.1% of 2008-09 graduates did so. A similar number of graduates took tenure-track jobs in 2008-09 as did in 2007-08. However, many more graduates went into academic positions as researchers and post-doctoral employees in 2008-09. The new NSF Computing Innovation Fellows program had a lot to do with supporting this shift. In aggregate, academic employment comprised nearly 36% of the total in 2008-09, much higher than the 30% figure from last year.
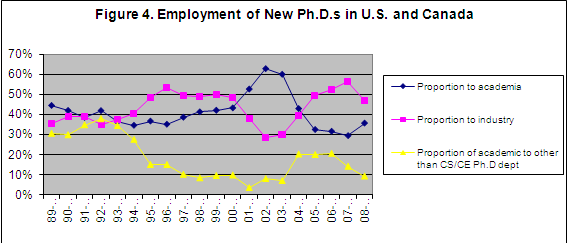
The unemployment rate for new Ph.D.s remains approximately 1%. The proportion of Ph.D. graduates who were reported taking positions outside of North America, among those whose employment is known, rose to 9.9% from 9.2% last year. It is back to its level from two years ago.
Table 4 also indicates the areas of specialty of new CS/CE Ph.D.s. Year-to-year fluctuations among these data are common and multi-year trends are difficult to discern. This year, more doctoral graduates specialized in architecture, information science and information assurance/security, while a smaller proportion specialized in databases/information retrieval, software engineering, operating systems and theory/algorithms. A large number of graduates were reported as having their degree in some area not specified.
Gender and ethnicity characteristics of enrolled doctoral students are similar to those of a year ago.
Master's and Bachelor's Degree Production and Enrollments (Tables 9-16)
This section reports data about enrollment and degree production for Master’s and Bachelor’s programs in the doctoral-granting departments. Although the absolute number of degrees and students enrolled reported herein only reflect departments that offer the doctoral degree, the trends observed in the master’s and bachelor’s data from these departments tend to strongly reflect trends in the larger population of programs that offer such degrees.
At the master’s degree level, production declined 5.2% in 2008-09, to 9,483 from last year’s 9,998 (Tables 9b-11b). The decline in CS departments was 6.7%. This decline is consistent with last year’s observation of lower enrollments in master’s programs, although not consistent with the departments’ own predictions of higher production. Master’s degree production also declined among I school departments, but increased in CE departments.
There was less than a 1% change in the proportion of female graduates among CS master’s recipients in 2008-09 (22.1% vs. 21.2% the previous year) and an overall 1% increase among total master’s recipients, due primarily to an increase in I school department graduates; in fact, for the past few years, there has been little change in the gender balance among master’s recipients. A higher fraction of the recipients were non-resident aliens in 2008-09 (62.2% vs. 55.8% the previous year in CS, and 55.2% vs. 49.5% the previous year overall) and this continues a trend toward a larger international graduating class, and correspondingly fewer U.S.-resident white graduates, among master’s recipients. Other ethnicity characteristics showed little change, but the fraction of master’s graduates in these other categories is small.
The number of new master’s students overall (Table 13) held steady this year at 7,593, though there was a slight increase (less than 2%) in the number of new students in computer science programs. A similar observation can be made for total master’s program enrollment. This suggests that future master’s degree production will not change much in the short term.
Overall bachelor’s degree production in 2009 was down 12% from that in 2008. Bachelor’s degree production in U.S. computer science departments also was down 12% (Tables 9a-11a). These decreases are a legacy of the decline in enrollments experienced earlier this decade, and also may be due in part to the decreased number of departments reporting.
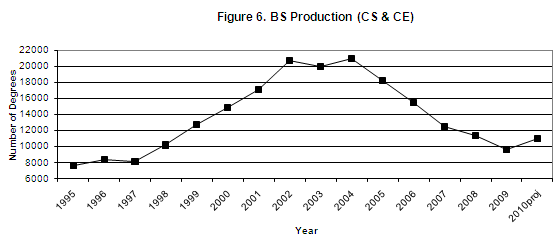
However, the number of new students in U.S. CS programs continues to increase (Table 14). There was an 8.5% increase in the number of new CS majors among U.S. computer science departments and a 9% increase in the number of new pre-majors (students who are pursuing a curriculum for the major in computer science but as yet have not declared their official major). Total enrollment among majors and pre-majors in U.S. CS departments increased 4.2%, and if only majors are considered, the increase is 5.5% over last year (Table 16). This is the second straight year of these increases, and should result in an increased number of bachelor’s degrees produced in these departments within another two years.
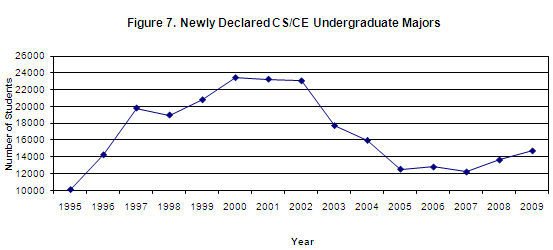
In Canada, the number of new CS majors increased by 8%, but the total number of CS majors declined by over 7%. Since relatively few Canadian departments participated, these trends are influenced significantly by the specific departments reporting. However, since the number of new CS majors in Canada increased for the second straight year, it appears that Canadian CS departments are headed for increased bachelor’s degree production as well.
Because of the newness of the I-school data, it is not appropriate to try to discern any enrollment patterns at this time. Computer engineering enrollment data appear comparable to those from last year in aggregate, although there are more majors and fewer pre-majors this year.
Gender and ethnicity data show similar patterns this year as last year (Tables 9aand 10a). Only 11.3% of bachelor’s graduates in CS were women, and 68.9% were white. The latter figure is an increase of 3 percentage points over last year, countered by slight declines in most of the other ethnicity categories.
Faculty Demographics (Tables 17-23)
For the first time in recent memory, actual faculty size declined this year, both in terms of total faculty as well as tenure-track faculty. Tenure-track faculty totals are down 6.7% from last year, and the total number of faculty is down 1.5% (Table 17). These declines are mitigated by the decrease in the number of departments reporting, particularly with respect to Canadian departments. Among U.S. CS departments the overall decline was 3%, but the top 24 departments experienced 1%-3% increases in the number of tenure-track faculty, while lower ranked departments experienced declines of 4% to 5% in their tenure-track faculty size (Table 18a). In aggregate, U.S. CS departments overestimated their faculty size by more than 6%.
There was a 7.7% increase in the number of postdocs and a 21% increase in the number of teaching faculty among the reporting departments. At U.S. CS departments the number of postdocs was fairly constant among the top 24 departments, with significant increases at the lower rankings, while for teaching faculty there were at least 25% increases in all the ranking strata. At least some of the increase in postdocs undoubtedly is due to the new Computing Innovation Fellows program (information at http://cifellows.org/).
Table 18b shows the clear effects of the economy on faculty hiring this past year. Whereas in 2007-08 there were 505 reported tenure-track faculty vacancies in the reporting departments, in 2008-09 there were only 254, roughly a 50% decrease. Among U.S. CS departments the decline was 38% and among U.S. I departments the decline was over 60%. Among all departments, the fraction of these positions that were filled rose from 26.7% in 2007-08 to 35.4% in 2008-09. This likely is due to a combination of the fact that there were fewer positions available and that, in 2007-08, halts in the hiring process took place in mid-year that affected the ability of several departments to complete searches that had begun.
The fraction of women hired into tenure-track positions rose from 21.9% in 2007-08 to 23.1% in 2008-09, close to its 23.9% level of 2006-07. This year’s level of tenure-track faculty hiring is again slightly above the fraction of new Ph.D.s who were women (21.2%). The fraction of women among new postdocs rose from 14.2% to 15.3%. Again there was an increased percentage of new faculty members who are Nonresident Aliens and an increase in the percentage of Asians, offset by a decreased percentage of Whites. The African American percentage of new tenure-track hires this year declined from 3.4% to 2.0%.
There was a slight increase in the overall fraction of women at each of the tenure-track ranks (Table 21). The largest increase was at the assistant professor level, where the fraction of women rose from 21.7% last year to 24.3% this year. There also are more Asians and fewer Whites among current faculty at each of the tenure-track ranks this year compared with last year (Table 22).
For next year, reporting departments forecast a 2% growth in tenure-track faculty. This is about half the growth rate forecast last year.
There was a 30% drop in the number of faculty losses this year, with fewer retirements and much less movement to other positions, both academic and non-academic. Economic conditions and the concomitant decline in the number of open positions undoubtedly affected these statistics (Table 23).
Research Expenditures and Graduate Student Support (Tables 24-26)
Table 24-1 shows the department's total expenditure (including indirect costs or "overhead" as stated on project budgets) from external sources of support. Table 24-2 shows the per capita expenditure, where capitation is computed two ways. The first is relative to the number of tenured and tenure-track faculty members. The second is relative to researchers and postdocs as well as tenured and tenure-track faculty. Canadian levels are shown in Canadian dollars. The data indicate that the higher the ranking, the more external funding is received by the department (both in total and per capita).
This year the mean total expenditures were flat among CS departments ranked 1-12, increased in CS departments ranked 13-36 (with a 15.7% increase in departments ranked 25-36), and decreased by nearly 16% in departments ranked below 36. Median total expenditures were fairly flat in rank 1-12 and ranks lower than 36, with 12% to 14% increases in ranks 13-36. Among U.S. I departments the mean rose and the median declined from last year, while among Canadian departments the mean declined and the median rose.
Per-capita expenditure results also were mixed this year. Among U.S. rank 1-12 CS departments, both mean and median funding were flat, except that using the second capitation method the median funding was down 8.5%. For rank 13-24 departments, mean funding was very slightly higher (1% to 3%) while median funding rose 6.5% using the first capitation method, but dropped 8.7% using the second capitation method. Rank 25-36 departments showed gains for both capitation methods in both mean and median expenditures, ranging from 4.9% for median expenditures using the second capitation method to 44% for means using the second capitation method. Departments ranked lower than 36 showed declines for both capitation methods in both mean and median expenditures, ranging from 7.3% to 11.8%. I departments showed increases in means and flat medians, while Canadian departments showed increased medians and decreased means. These clearly were influenced by the specific departments reporting this year vs. last year.
Table 25 shows the number of graduate students supported as full-time students as of fall 2009, further categorized as teaching assistants (TAs), research assistants (RAs), fellows, or computer systems supporters, and split between those on institutional vs. external funds. The number of TAs in CS departments decreased between 10% and 20% this year, depending on ranking strata. However, departments appeared to be able to support at least as many students in total this year as last year, generally through shifting TA support to either RA or fellow support.
Median stipends for TAs and RAs declined at least 5% in more highly ranked U.S. CS departments, while they remained fairly steady in lower ranked departments (Table 26). Entries in this table show the net amount (as of fall 2009) of an academic-year stipend for a first-year doctoral student (not including tuition or fees). Canadian stipends are shown in Canadian dollars.
Faculty Salaries (Tables 27-35)
Each department was asked to report individual (but anonymous) faculty salaries if possible; otherwise, the department was requested to provide the minimum, median, mean, and maximum salaries for each rank (full, associate, and assistant professors and non-tenure-track teaching faculty) and the number of persons at each rank. The salaries are those in effect on January 1, 2010. For U.S. departments, nine-month salaries are reported in U.S. dollars. For Canadian departments, twelve-month salaries are reported in Canadian dollars. Respondents were asked to include salary supplements such as salary monies from endowed positions.
The tables contain data about ranges and measures of central tendency only. Those departments reporting individual salaries were provided more comprehensive distributional information in December 2009. This year, 83% of those reporting salary data provided salaries at the individual level.
We also report salary data based on time in rank. When comparing individual or departmental faculty salaries with national averages, time in rank may make the analysis more meaningful. We report associate professor salaries for time in rank of 7 years or less, and of more than 7 years. For full professors, we report time in rank of 7 years or less, 8-15 years, and more than 15 years.
The minimum and maximum of the reported salary minima (and maxima) are self-explanatory. The range of salaries in a given rank among departments that reported data for that rank is the interval ["minimum of the minima," "maximum of the maxima"].
The mean of the reported salary minima (maxima) in a given rank is computed by summing the departmental reported minimum (maximum) and dividing by the number of departments reporting data at that rank. The “average of dept median salaries” at each rank is computed by summing the individual medians reported at each rank and dividing by the number of departments reporting at that rank. Thus, it is not a true median of all the salaries. Similarly, "average of dept mean salaries” at each rank is computed by summing the individual means reported at each rank and dividing by the number of departments reporting at that rank. Thus, it is not a true average of all the salaries.
Overall U.S. CS average salaries (Table 27) increased between 0.4% and 1.6%, depending on tenure-track rank, and 1.0% for non-tenure-track teaching faculty. Assistant professor average salaries had the lowest increases this year, and in general, the increases are lower than those experienced in the past few years for all faculty ranks. This is not surprising given the economic situation in effect when these salary increases were decided.
Canadian salaries (Table 33) rose 3.6% to 5.5% among tenure-track ranks, with thelargestincrease at the assistant professor rank and the smallest at the full professor rank. Non-tenure-track teaching faculty salaries for Canadian departments rose only 0.6%. Because of the sample sizes, Canadian values are affected more strongly than are U.S. values by the particular set of schools that responded to this year’s survey compared to those who responded last year.
Average salaries for new Ph.D.s (those who received their Ph.D. last year and then joined departments as tenure-track faculty) increased 1.5% from those reported in last year’s survey (Table 35). This is similar to the 1.2% increase that was observed last yearfor new Ph.D.s. Again this year, there were too few new Ph.D. salaries in Canadian departments to make meaningful comparisons.
Additional Department Profiles Analysis
Every three years, the Taulbee Survey collects data about elements of department activities that are not expected to change much from year to year. Included are data about teaching loads, sources of external funding, methods of recruiting graduate students, department support staff, and space. The most recent data about these activities were collected in the 2005-06 Taulbee Survey. The results of this survey are available on the CRA web site at (http://archive.cra.org/statistics/survey/0506.pdf). Since I departments were not surveyed then, no comparative statements can be made with previous data for these departments.
Teaching Loads (Tables 36-39)
Compared with three years ago, mean teaching loads are slightly higher among Canadian departments and U.S. departments ranked lower than 24, and slightly lower among U.S. CE departments and the top 24 U.S. CS departments (Table 36). Median teaching loads are lower in departments ranked 13-24 and are higher in departments ranked 25-36, but the same in other strata. Nearly all departments allow reductions from the standard load (similar to three years ago), while about two-thirds allow increases (somewhat less than the 73% that did so three years ago) (Table 37a). Tables 37b and38 show the reasons why these increases and decreases are allowed. These percentages are similar to those three years ago, although in aggregate more departments (86% vs. 76% three years ago) now allow reductions for administrative duties. The inclusion of I departments, in which 100% of those reporting allow reductions for administrative duties, is largely responsible for this overall increase.
Sources of External Funding (Tables 40-46)
Among U.S. top 12 departments, the most significant changes in sources of research funding are a decline in the fraction of funding from DARPA (to 13.1% from 21.6% three years ago) and increases from NIH funding (to 5.2% from 2.7%) and from industry sources (to 17.7% from 12.2%). Departments ranked 13-24 exhibited similar directional changes in these same categories. Departments ranked 25-36 showed shifts from NSF, DARPA and NIH to industry and other defense sources. Departments ranked lower than 36 showed less volatility in the funding sources, although they also showed decreased support from DARPA (from 5% to 1.7%). Computer engineering departments showed declines in DARPA, DOE and state agency share of support, while showing an increase in the share from other defense sources. As Table 46 shows, overall DARPA funding dropped from 10.8% of the total to 5.9% of the total, while NIH and industry increased somewhat as sources of support.
Canadian departments showed an increase in the proportion of their funding from NSERC, from 40.5% to 46.6%, and a corresponding decline in the proportion from other federal sources (from 15.3% to 9.0%).
Other Graduate Student Data (Tables 47-49)
Table 47 shows the factors affecting graduate student stipends. Overall, each of the factors affects stipends in a smaller percentage of departments than was the case three years ago. However, there are differences in the specific strata. For example, advancement to the next stage of the graduate program and years of service each affect stipends in a greater percentage of departments ranked 1-12 and 25-36. GPA affects a greater percentage of departments ranked 13-24, and recruiting enhancements affect a greater percentage of departments ranked 13-36. Within these U.S. CS departments ranking strata, the differences typically reflect a change in only one department of the 12.
Overall, there is a somewhat smaller percentage of departments that use stipend enhancements and summer support as recruiting incentives, as compared with three years ago (Table 48).
Departmental Support Staff (Tables 50-52)
The median amount of administrative staff declined in U.S. CS departments ranked 1-24, and was comparable in other U.S. CS and in Canadian departments. Median computer support staff fell in rank 13-24 departments, but rose slightly in departments ranked 25-36. Median number of research support staff fell in top 12 departments, but there appeared to be slight increases in overall research support staff among other U.S. CS departments.
Space (Tables 53-60)
Median total space, as well as conference room and seminar space, rose in all U.S. CS ranking strata and in Canadian departments, but fell in U.S. CE departments. Research lab space rose except in U.S. CS rank 13-24 and CE departments. On the other hand, instructional lab space decreased except for Canadian departments. Office space changes were less consistent across the strata. The CE departments’ anomaly likely is influenced by the particular departments reporting this year versus those who reported three years ago.
About one quarter of departments report definite plans for increased space, with most of this planned for the next two years.
Concluding Observations
The fact that student interest in undergraduate computing programs continues to increase is heartening to our profession and consistent with the interests of governments in nurturing STEM(M) disciplines. While we have increased worldwide participation in our graduate programs, it would be helpful to also increase interest in these graduate programs among domestic graduates of our bachelor’s programs.
The changing economic conditions that affected Ph.D. employment this past year may continue for another year, but we can hope for an economic recovery that will restore a better balance in industry vs. academic employment soon. Though production of new CS Ph.D.s has declined, it remains high and is forecast to continue to do so. Thus, both the academic and corporate sectors need to be strong so that the talents of these graduates can be used to maximal advantage.
Rankings
For tables that group computer science departments by rank, the rankings are based on information collected in the 1995 assessment of research and doctorate programs in the United States conducted by the National Research Council (NRC) [see http://www.cra.org/statistics/nrcstudy2/home.html].
The top twelve schools in this ranking are: Stanford, Massachusetts Institute of Technology, University of California (Berkeley), Carnegie Mellon, Cornell, Princeton, University of Texas (Austin), University of Illinois (Urbana-Champaign), University of Washington, University of Wisconsin (Madison), Harvard, and California Institute of Technology. All schools in this ranking participated in the survey this year.
CS departments ranked 13-24 are: Brown, Yale, University of California (Los Angeles), University of Maryland (College Park), New York University, University of Massachusetts (Amherst), Rice, University of Southern California, University of Michigan, University of California (San Diego), Columbia, and University of Pennsylvania.4 All schools in this ranking participated in the survey this year.
CS departments ranked 25-36 are: University of Chicago, Purdue, Rutgers, Duke, University of North Carolina (Chapel Hill), University of Rochester, State University of New York (Stony Brook), Georgia Institute of Technology, University of Arizona, University of California (Irvine), University of Virginia, and Indiana. All schools in this ranking participated in the survey this year.
CS departments that are ranked above 36 or that are unranked that responded to the survey include: Arizona State University, Auburn, Binghamton, Boston University, Case Western Reserve, City University of New York Graduate Center, Clarkson, College of William and Mary, Colorado School of Mines, Colorado State, Dartmouth, DePaul, Drexel, Florida Institute of Technology, Florida International, Florida State, George Mason, George Washington, Georgia State, Illinois Institute of Technology, Iowa State, Johns Hopkins, Kansas State, Kent State, Lehigh, Louisiana State, Michigan State, Michigan Technological, Mississippi State, Montana State, Naval Postgraduate School, New Jersey Institute of Technology, New Mexico Institute of Mining and Technology, New Mexico State, North Carolina State, Northeastern, Northwestern, Oakland, Ohio State, Old Dominion, Oregon State, Pace, Pennsylvania State, Polytechnic, Portland State, Rensselaer Polytechnic, Rochester Institute of Technology, Southern Illinois University (Carbondale), Stevens Institute of Technology, Syracuse, Texas A&M, Texas Tech, Toyota Technological Institute (Chicago), Tufts, Vanderbilt, Virginia Tech, Washington State, Washington (St. Louis), Wayne State, Worcester Polytechnic, and Wright State.
University of: Alabama (Birmingham and Tuscaloosa), Albany, Arkansas (Fayetteville), Buffalo, California (at Davis, Irving, Riverside, and Santa Cruz), Cincinnati, Colorado (Boulder), Connecticut, Delaware, Florida, Georgia, Idaho, Illinois (Chicago), Iowa, Kansas, Kentucky, Louisiana (Lafayette), Maine, Maryland (Baltimore Co.), Massachusetts (at Boston and Lowell), Minnesota, Mississippi, Missouri (at Columbia), Nebraska (Lincoln), Nevada (Las Vegas and Reno), New Hampshire, New Mexico, North Carolina (Charlotte), North Texas, Notre Dame, Oklahoma, Oregon, Pittsburgh, South Carolina, South Florida, Southern Mississippi, Tennessee (Knoxville), Texas (at Arlington, Dallas, El Paso, and San Antonio), Tulsa, Utah, and Wyoming.
Computer Engineering departments participating in the survey this year include: Boston University, Florida Institute of Technology, Iowa State, Northeastern, Princeton, Santa Clara University, Virginia Tech, and the Universities of California (Santa Cruz), Houston, Iowa, New Mexico, Rochester, and Southern California.
Canadian departments participating in the survey include:Dalhousie, McGill, Memorial, Queen's, Simon Fraser, and York Universities, and the Universities of: Alberta, British Columbia, Calgary, Manitoba, Montreal, New Brunswick, Ottawa, Saskatchewan, Toronto, Waterloo, and Western Ontario.
Information departments participating in the survey include:Drexel, Indiana, Penn State, and Syracuse Universities, and the Universities of: California (Berkeley, Irvine, Los Angeles, and Santa Cruz), Maryland (College Park and Baltimore County), Michigan, Pittsburgh, and Texas (Austin).
Acknowledgments
Betsy Bizot once again provided valuable assistance with the data collection, tabulation, and analysis for this survey. Thanks also are due to Susanne Hambrusch and Jean Smith for their careful reading of the report and for their helpful suggestions to improve it.
Endnotes
- The title of the survey honors the late Orrin E. Taulbee of the University of Pittsburgh, who conducted these surveys for the Computer Science Board until 1984, with retrospective annual data going back to 1970.
- Information (I) programs included here are Information Science, Information Systems, Information Technology, Informatics, and related disciplines with a strong computing component. In fall 2008, the first year these programs were surveyed as part of Taulbee, surveys were sent to CRA members, the CRA-Deans IT group members, and participants in the iSchools Caucus (www.ischools.org) who met the criteria of granting Ph.D.s and being located in North America. Other I-programs who meet these criteria and would like to participate in the survey in future years are invited to contact survey@cra.org for inclusion.
- The set of departments responding varies slightly from year to year, even when the total numbers are about the same; thus, we must approach any trend analysis with caution. We must be especially cautious in using the data about CE and I departments because of the low response rate.
- Although the University of Pennsylvania and the University of Chicago were tied in the National Research Council rankings, CRA made the arbitrary decision to place Pennsylvania in the second tier of schools.
- All tables with rankings: Statistics sometimes are given according to departmental rank. Schools are ranked only if they offer a CS degree and according to the quality of their CS program as determined by reputation. Those that only offer CE or I degrees are not ranked, and statistics are given on a separate line, apart from the rankings.
- All ethnicity tables: Ethnic breakdowns are drawn from guidelines set forth by the U.S. Department of Education.
- All faculty tables: The survey makes no distinction between faculty specializing in CS vs. CE programs. Every effort is made to minimize the inclusion of faculty in electrical engineering who are not computer engineers.


1828 L STREET, NW SUITE 800, WASHINGTON, DC 20036 | P: 202-234-2111 | F: 202-667-1066