Computing Research News
April 2014 Vol. 26/No.4
Time to Degree in Computing
By Betsy Bizot, CRA Director of Statistics and Evaluation
How long does it take to finish a Ph.D. in computing? This is important information for departmental planning and for students considering the commitment involved in a Ph.D. program, but it is not readily available. This article addresses five questions:
- What is the median time to degree in computing?
- How does computing compare with other fields in this?
- What is the distribution of time to degree, beyond the median?
- Are there differences in time to degree for subgroups by gender, citizenship status, underrepresented minority status, or Carnegie class of granting institution?
- How does attrition in Ph.D. computing programs compare to other fields?
All data reported here, except for attrition, come from the Survey of Earned Doctorates (SED, http://www.nsf.gov/statistics/srvydoctorates/ ). The SED is administered in the fall of each year to everyone who completed a doctoral degree at a U.S. institution in the previous academic year. It includes the information needed to compute time to degree in two ways: as time since completion of the bachelor’s degree, and as time since first enrolling in a graduate program (enrolling in any graduate program, not necessarily in the institution and program from which the student earned the Ph.D.).
Median Time to Degree in Computing Compared to Other Fields
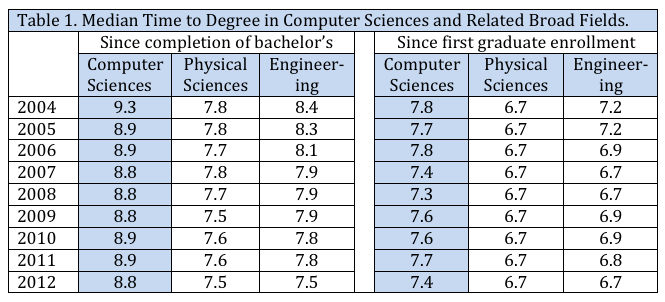
Table 1 compares the median time to Ph.D. for degrees in Computer Sciences1 completed between 2004 - 2012, with time to degree calculated both ways, against the time to degree for other broad fields. Overall, a PhD in computing takes about 7.6 years from first beginning a graduate program, close to a year longer than a Ph.D. in engineering or in physical sciences (which includes computer sciences). There is some fluctuation in length of time over the years, but no observable trend in computer sciences.
Because there is little change in the median for computer sciences over time, for additional analyses the students were grouped into two cohorts: those who completed their degree in 2004-2008, and those who completed their degree in 2009-2012. This gives a larger sample size for investigating small subgroups of students. Additional analyses also use only the time since first graduate enrollment.
Distribution of Time to Degree
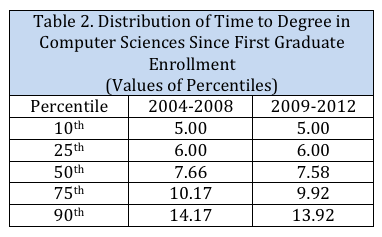
Table 2 provides more distribution information on time to degree since first entering a graduate program for the 2004-2008 and 2009-2012 cohorts. The short tail is not terribly short; not surprisingly, fewer than 10% of PhD recipients took less than 5 years after entering graduate school to complete their degree. The long tail, on the other hand, stretches out. Seventy-five percent of degree completers finished within 10 years of beginning graduate school and 90% within 14 years.
Subgroup Differences in Time to Degree in Computer Sciences
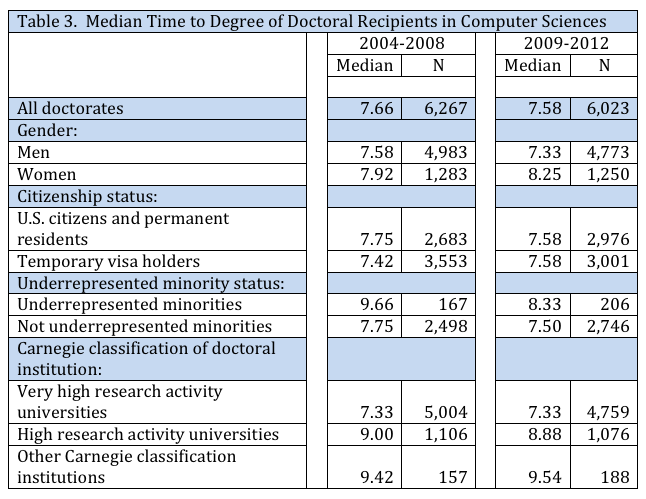
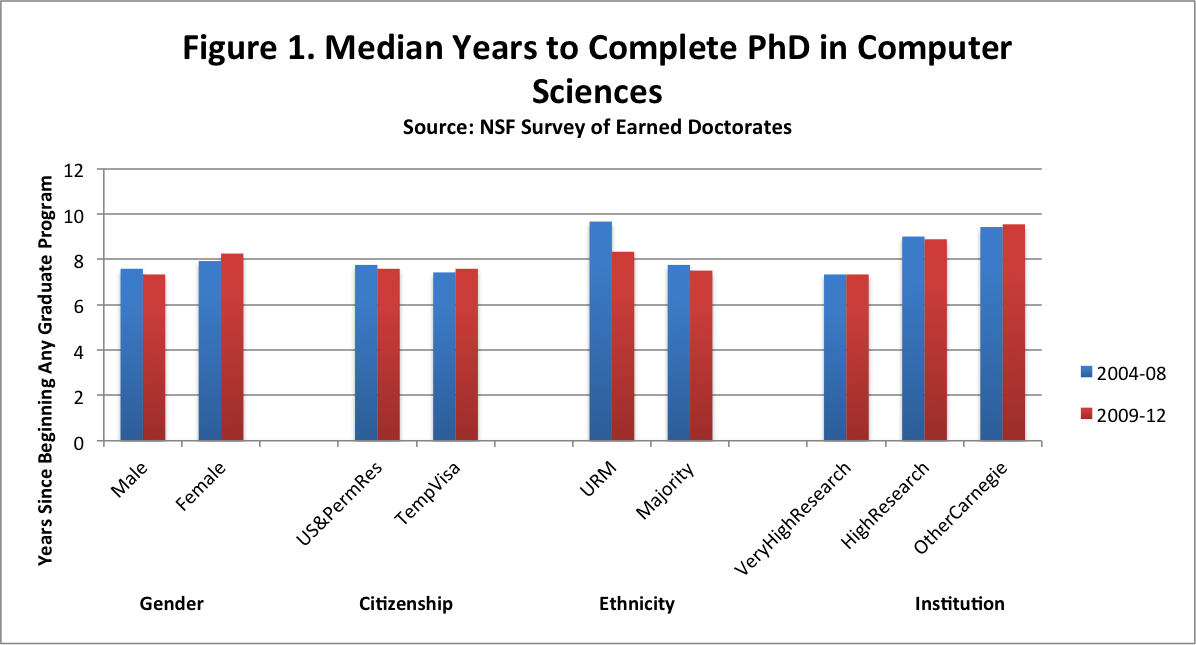
Table 3 and Figure 1 show the median time to complete a Ph.D. since first beginning a graduate program, for each subgroup, for each cohort.
Gender . Women take longer than men. This is true in both cohorts; there is a larger difference (almost a year) in the second cohort.
Citizenship status. In the earlier cohort, students on temporary visas take less time than citizen or permanent resident students. In the later cohort, the median times of the two groups are exactly the same.
Minority status. Students from underrepresented minorities (URM) - that is, racial and ethnic groups underrepresented in computing - take longer than majority students to complete a Ph.D.. In the first cohort, the difference is almost two years; in the second cohort it is close to one year.
Carnegie Class. Eighty percent of doctorates in computing are granted by “Very high research activity” institutions; students at those institutions take noticeably less time to complete their degrees than those at the less-research-intensive institutions.
Discussion
These numbers raise additional questions. For example, it seems unlikely that students on the high end of the time to degree distribution spent 14 years full time in a graduate program; probably the long-completers took time off during graduate school (between master’s and Ph.D., or as a leave of absence during the Ph.D. program) or went part time for some or all of the program. More importantly, why do women and URM students take longer to complete a degree? Are they more likely to have taken a leave of absence or to go part time or are they taking more time in regular full time degree programs, and in either case, why?
Attrition
Time to degree is only informative for students who complete a degree. A related question is that of attrition: how many students begin a Ph.D. program but never complete a Ph.D.? These are challenging data to collect; challenging for departments, because it is not always clear when attrition happens (will the student taking a leave of absence return?), and challenging for statisticians because it is hard to locate and survey students who have left their degree programs.
The Council of Graduate Schools recently conducted a Ph.D. Completion Project. Participating institutions submitted information on their Ph.D. programs in selected fields; one of those fields was Computer and Information Sciences, and 15 institutions submitted data on 17 CIS Ph.D. programs. Data were collected on the ten-year completion rate of two groups of students, those beginning a Ph.D. program in the 1992-93 through 1994-95 academic years, and those beginning in 1995-96 to 1997-98. The CGS report on Ph.D. Completion and Attrition: Baseline Data from the Ph.D. Completion Project (2007) shows CIS with the lowest rate of 10-year completion (41.5%, compared to the engineering average of 63.6% and the mathematics and physical sciences average of 54.7%). Conversely, CIS had the highest rate of attrition (25.4% attrition within the first two years compared to 14.5% for engineering and 17.8% for mathematics and physical sciences; 51.4% attrition at the end of 10 years compared to 26.7% for engineering and 36.9% for mathematics and physical sciences.)
It should be taken into account that this 10-year period included the dot-com boom, and that computing students may have had more temptation and more opportunity to leave a Ph.D. program than students in other fields or at other times. It would be interesting to see comparable numbers for students beginning Ph.D. programs in 2001-02 through 2003-04, but no such data has been collected.
Further information on the Ph.D. Completion Project, including the publication referenced above, is available at www.phdcompletion.org.
Acknowledgements
Thanks to Mark Fiegener, SED Project Officer, Human Resources Statistics Program, NSF, who provided the SED data specific to computer sciences.
1NSF defines Computer Sciences as computer science, information science, and other closely related fields, but not including computer engineering.
2Underrepresented minorities in computing include American Indian/Native American, African-American/black, Native Hawaiian or Pacific Islander, and Hispanic.
SOURCE for Tables 1-3 and Figure 1: National Science Foundation, National Center for Science and Engineering Statistics, NSF/NIH/ED/USDA/NEH/NASA Survey of Earned Doctorates. Computer Sciences data: special tabulation (March 2014). Other data: Annual reports of Doctorate Recipients from U.S. Universities.


1828 L STREET, NW SUITE 800, WASHINGTON, DC 20036 | P: 202-234-2111 | F: 202-667-1066