Computing Research News
September 2012 Vol. 24/No.1
Taulbee In-Depth: PhD Specialty Areas
By Betsy Bizot, CRA Director of Statistics and Evaluation
The CRA Taulbee Survey reports new PhDs and their employment by specialty area each year. This article is an in-depth look at these numbers for data gathered in 2008 – 2011 including a total of 7,178 PhDs. Results by specialty area are presented only for those with specialty areas that are not “other” or “unknown,” which is a total of 5,666 PhDs (78.9%). Similarly, percentages by gender, ethnicity, and citizenship are only for those who were not reported as “unknown.”
Overall summary
79.6% male, 20.3% female
3.6% resident underrepresented minority (Black/African-American, Native American, Native Hawaiian/Pacific Islander, or Hispanic of any race), 45.6% resident majority, 50.8% nonresident
79.3% had a known type of employment (20.7% were unknown or other). Of those with known employment, 23.5% went to academia (tenure-track, research, and teaching), 18.2% to postdocs, and 58.2% to industry/government.
Specialty Areas by Gender
The overall percent of women receiving PhDs in computing was 20.3%, but this representation is unevenly distributed across specialty areas. Table 1 shows numbers and percentages of specialty area by gender over the four years. Representation as measured by the percentage of graduates within a specialty who are women is one measure of women’s participation; raw numbers of women completing PhDs in a specialty is another. Because there are higher numbers of students graduating with specialties in Artificial Intelligence and Software Engineering, these areas have relatively high total numbers of women even though the percent of women in these areas is about average.
Highest Representation of Women (% within area): Information Science (38%), Human-Computer Interaction (36%), and Databases/Information Retrieval (26%).
Highest Numbers of Women: Artificial Intelligence, Databases/Information Retrieval, and Software Engineering
Lowest Representation of Women (% within area): Programming Languages/Compilers, Operating Systems, and Graphics/Visualization (all 14%).
Table 1: Specialty Area of Computing PhDs by Gender, 2008-2011.
|
Speciality Area |
Male |
% of specialty Male |
Female |
% of specialty Female |
Total |
% of PhDs in |
|
Artificial Intelligence |
579 |
81.0% |
136 |
19.0% |
715 |
12.9% |
|
Computer-Supported Cooperative Work |
29 |
74.4% |
10 |
25.6% |
39 |
0.7% |
|
Databases/Information Retrieval |
335 |
74.0% |
118 |
26.0% |
453 |
8.2% |
|
Graphics/Visualization |
339 |
85.8% |
56 |
14.2% |
395 |
7.1% |
|
Hardware/Architecture |
239 |
82.1% |
52 |
17.9% |
291 |
5.3% |
|
Human-Computer Interaction |
158 |
64.5% |
87 |
35.5% |
245 |
4.4% |
|
High-Performance Computing |
109 |
77.3% |
32 |
22.7% |
141 |
2.5% |
|
Informatics: Biomedica/Other Science |
197 |
76.1% |
62 |
23.9% |
259 |
4.7% |
|
Information Assurance/Security |
243 |
84.7% |
44 |
15.3% |
287 |
5.2% |
|
Information Science |
56 |
62.2% |
34 |
37.8% |
90 |
1.6% |
|
Information Systems |
105 |
75.5% |
34 |
24.5% |
139 |
2.5% |
|
Networks |
489 |
82.2% |
106 |
17.8% |
595 |
10.7% |
|
Operating Sysyems |
191 |
86.0% |
31 |
14.0% |
222 |
4.0% |
|
Programming Languages/Compilers |
200 |
85.5% |
34 |
14.5% |
234 |
4.2% |
|
Robotics/Vision |
211 |
84.7% |
38 |
15.3% |
249 |
4.5% |
|
Scientific/Numerical Computing |
85 |
76.6% |
26 |
23.4% |
111 |
2.0% |
|
Social Computing/Social Informatics |
57 |
68.7% |
26 |
31.3% |
83 |
1.5% |
|
Software Engineering |
422 |
78.3% |
117 |
21.7% |
539 |
9.7% |
|
Theory and Algorithms |
367 |
81.9% |
81 |
18.1% |
448 |
8.1% |
|
Total |
4,411 |
79.7% |
1,124 |
20.3% |
5,535 |
|
Specialty Areas by Ethnicity
Even aggregated across four years, numbers of underrepresented minorities are low; 15 of the 19 specialty areas graduated 12 or fewer URM students in the four years. Percentages are not reliable when the numbers are that low, and therefore representation by percentage of underrepresented minorities is not discussed. The four specialty areas graduating more than 12 URM students were Artificial Intelligence (27), Software Engineering (20), Human-Computer Interaction (16), and Databases/Information Retrieval (14). Specialty areas graduating fewer than 5 URM students in four years are Information Systems (4), High-Performance Computing (3), Scientific/Numerical Computing (3), and Computer-Supported Cooperative Work (3, but note that CSCW has a particularly small number of total graduates).
Specialty Area by Citizenship
60% or more of degrees in the following specialty areas went to nonresident students: Databases/Information Retrieval (60%), Hardware/Architecture (60%), and Networks (69%). The smallest percentages of degrees to nonresident students were in the areas of Social Computing/Social Informatics (29%), Information Science (31%), and Human-Computer Interaction (31%).
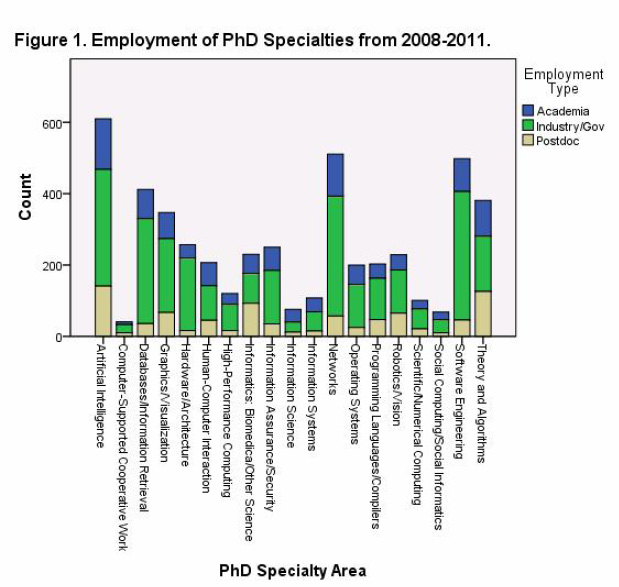
Specialty Areas by Employment Type
Figure 1 shows the employment type by specialty area over the four years. The greatest number of hires in industry are from Software Engineering (360), Networks (336), Artificial Intelligence (327), and Databases/Information Retrieval (294). The greatest numbers of postdocs are from Artificial Intelligence (141), Theory and Algorithms (126), and Informatics (93). The ratio of postdocs to industry hires is 31% overall; areas in which it is disproportionately high (higher proportion of postdocs) are Informatics (111%), Theory and Algorithms (81%), and Robotics/Vision (54%). Areas in which it is disproportionately low (lower proportion of postdocs) are Hardware/Architecture (8%), Databases/Information Retrieval (12%), and Software Engineering (13%).


1828 L STREET, NW SUITE 800, WASHINGTON, DC 20036 | P: 202-234-2111 | F: 202-667-1066