Computing Research News
November 2011 Vol. 23/No. 5
Increasing Women and Underrepresented Minorities in Computing Research Careers:
The CRA-W/CDC Alliance
By Manuel Pérez-Quiñones, Betsy Bizot, Kathleen Fisher
CRA-W and CDC have been working since the mid 1990s to encourage women and underrepresented minorities, respectively, toward graduate school and research careers in the computing field. In 2005, the two organizations collaborated on a proposal to the National Science Foundation's Broadening Participation in Computing (BPC) program and in 2006 they were awarded funding. The result was the Widening the Research Pipeline Alliance, one of 16 Alliances currently funded by the BPC program. Our alliance manages programs that encourage individuals to begin and remain on the path to a research career.
The Alliance faced a challenge when it came time to assess the impact of the programs we manage. The Alliance is national in scope and participants in our programs come as individuals rather than as institutions. As a result, there is no natural comparison group. National comparison data for nonparticipants are generally unavailable; national samples tend to be either outdated or have too few participants in computing (especially women and underrepresented minorities) to allow detailed comparison on the factors that interest us. Yet, we need to know if our programs are indeed making an impact.
The Data Buddy project was created to fill this void. Its primary purpose is to evaluate Alliance programs by comparing outcomes for program participants to those for nonparticipants. The secondary purpose is to gather more general baseline information about the ways that undergraduate and graduate students in computing make decisions about graduate school and research careers. Ultimately, we want to help departments and program designers improve outcomes for all students, particularly for members of underrepresented groups, with an emphasis on encouraging promising students toward research careers.
To develop comparison groups we recruited Data Buddy departments to partner with us for ongoing data collection and analysis. Our reasoning was that these departments would facilitate individual-level data collection from their students and faculty and provide department-level data, thus increasing both the quality and quantity of collected data. In return for their participation, departments receive customized reports, summarizing information about their students and comparing them to students at peer institutions to the extent allowed by confidentiality concerns. In fact, some colleges informed us that they were planning to use the data for their program evaluations. In addition to summary reports, the departments that are part of our invited sample were offered a monetary incentive for their participation.
The project plans multiple waves of surveys. The first wave, in spring 2011, surveyed undergraduate and graduate students who completed or were completing degrees between September 2010 and August 2011. The second wave, in fall 2011, will include all undergraduate and graduate students. The third wave, tentatively planned for winter 2012, will include faculty and postdocs.
Experimental Design
The full details of our method, data collection, and results from the first wave of surveys in spring 2011 are available at the project page http://www.cra.org/databuddies.
Many characteristics and conditions affect the participation of women and underrepresented minorities in research careers in computing. Our logic model (a way of connecting program activities to intended outcomes and ways of measuring those outcomes) includes variables theorized and supported by research into Bandura's Theory of Self-Efficacy (1977), Eccles' Expectancy Value Theory (2000), Lent's Social Cognitive Model (1994), Magolda's Self-Authorship Theory (Creamer & Laughlin 2005), and Social Capital Theories (Seibert & Kraimer 2001), for example. Our survey included questions about students' awareness of career research options, students' interest in the next step toward a research career, development of technical credentials, knowledge of how to move on to the next step (e.g., graduate school application, financial aid), confidence that they can succeed at the next level, and use of their professional networks. In addition, we assessed the extent to which students progressed toward and reached major milestones toward a research career in computing and what factors influenced their decisions.
First Wave Results
The recruited departments were stratified into four program type groups: 1) Top-ranked PhD programs; 2) Other PhD programs; 3) Master's-granting programs; and 4) Four-year program institutions/liberal arts colleges. Note that the distinctions between PhD, master's, and four-year programs were for the computing department, not the institution as a whole. In spring 2011, forty-six departments participated in the surveys of completing students, including 8 PhD programs ranked 1-36, 13 other PhD programs, 8 masters programs, and 17 four-year programs. Table 1 shows the responses received.
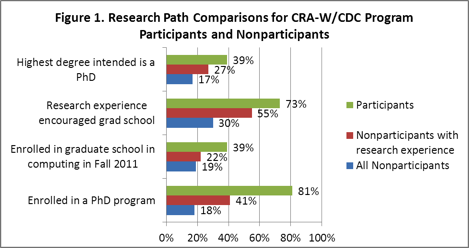
Overall, participants in our two undergraduate research experience programs have better outcomes than nonparticipants, as shown in Table 2 and Figure 1. More participants than nonparticipants intended their highest degree to be a PhD, more of them said that their undergraduate research experience encouraged them to continue to graduate school immediately after completing their undergraduate degree, more of them had already enrolled in a graduate program for the fall of 2011, and more of those who were enrolling in graduate school were enrolling in PhD programs. The results are favorable for our programs even when comparing against nonparticipants who had other research experience (had participated in other NSF REU programs, for example).
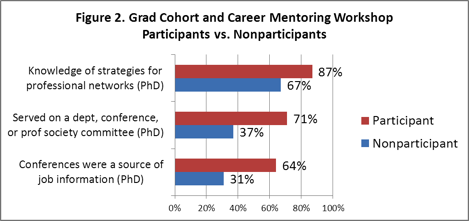
Among the graduate survey results, we find that participants in our programs engage in the research community at higher rates than nonparticipants. As shown in Table 3 and Figure 2, among PhD graduates participants report better knowledge of strategies for developing professional networks, have served on service committees at higher rates than nonparticipants, and were more likely to have found conferences a source of job information. Additionally, some potentially interesting results about employment indicate that participants completing PhDs are more likely to take postdocs and less likely to take non-research industry employment than nonparticipants, but we need more data before we can claim these with certainty because the number of survey responses for that particular question was small.
Finally, and most interesting, we found that participation in our programs was one of the two factors most strongly predicting enrollment in graduate school in computing. The other, not surprisingly, was undergraduate GPA. A logistic regression analysis showed that participation in our programs is equally as predictive of graduate school enrollment as GPA, with B coefficients of .783 for program participation and .737 for GPA (both significant at the .05 level). The full model holds constant the effects of gender, race, institution type, and parental education and is included in the project report. This is a fantastic finding that shows the positive effect of the programs under our Alliance.
Value to the Computing Community
The Data Buddy project is funded for just one year. If funded to continue, we will begin to build longitudinal data on participants and nonparticipants. This will help the Computing Community in three ways. First, we will be able to better assess CRA-W and CDC efforts to increase participation of women and underrepresented minorities. Second, the collected data set will allow the Computing Community to evaluate other efforts to Broaden Participation, not just under BPC Alliances, but other efforts in which individual departments might engage on their own. And third, we will develop better information on the factors that encourage students to choose research careers in computing.
Ways You Can Participate
If the Data Buddy project continues, and we believe that it will, we can accept additional departments into the survey on a volunteer basis. As with the sampled departments, volunteer departments will help us survey their students and will receive a departmental report if enough students from their department respond. Also, look for us on the Snowbird program next summer; a session on Data will discuss Data Buddies as well as the Taulbee Survey.
For further information, contact the authors or email databuddies@cra.org.
Acknowledgments
Thanks to Joanne Cohoon (CRA-W board), Kenneth Hines (CRA staff), Ingrid Pufahl (CRA consultant), Tom McKlin and Shelly Engelman (The Findings Group) for their contributions to the project and this report. Thanks also to the Data Buddy departments and to the students who completed surveys.
|
Table 1. Responses to Data Buddies Spring 2011 Surveys |
|||
|
Group |
Invited |
Completed |
Response rate |
|
Undergraduate programs (CREU/DREU) |
|||
|
Undergraduate Participants |
50 |
30 |
60.0% |
|
Contacted by Departments |
870* |
320 |
~37% |
|
We Contacted |
949 |
356 |
37.5% |
|
Graduate programs (Grad Cohort/Career Mentoring Workshops) |
|||
|
Graduate Participants |
47 |
39 |
83.0% |
|
Contacted by Departments |
1140* |
304 |
~27% |
|
We contacted |
549 |
212 |
38.6% |
*Estimated
|
Table 2. Undergraduate Results |
||||||
|
Percentages |
Number Responding to Question |
|||||
|
All Non-participants |
Non-participants with research experience |
Participants |
All Non-participants |
Non-participants with research experience |
Participants |
|
|
Highest degree intended is a PhD |
17% |
27% |
39% |
41 |
207 |
588 |
|
Research experience encouraged grad school immediately |
30% |
55% |
73% |
41 |
195 |
493 |
|
Enrolled in graduate school in computing in Fall 2011 |
19% |
22% |
39% |
41 |
195 |
526 |
|
Enrolled in a PhD program |
18% |
41% |
81% |
16 |
49 |
111 |
|
Table 3. Graduate Results |
||||
|
Percentages |
Total Responding to Question |
|||
|
Non-participant |
Participant |
Non-participant |
Participant |
|
|
Conferences were a source of job information (PhD) |
31% |
64% |
55 |
11 |
|
Served on a departmental, conference, or professional society committee (PhD) |
37% |
71% |
122 |
24 |
|
Knowledge of strategies for developing professional networks (PhD) |
67% |
87% |
93 |
23 |


1828 L STREET, NW SUITE 800, WASHINGTON, DC 20036 | P: 202-234-2111 | F: 202-667-1066