Computing Research News
April 2014 Vol. 26/No.4
1st CRA-W/CDC Broadening Participation in Visualization (BPViz) Workshop
By Dr. Vetria L. Byrd, Clemson University
On February 10-11, 2014, Clemson University catapulted to the forefront of efforts to broaden participation in discipline specific domains. Clemson Computing and Information Technology Department hosted the 1st CRA-W/CDC Broadening Participation in Visualization Workshop (citi.clemson.edu/bpviz2014). The workshop was held at Clemson University in Clemson, South Carolina. This herculean effort of organizing and planning was met with lofty goals, and logistical intricacies that culminated in success, despite the rare hiccup by Mother Nature affectionately known as the polar vortex.
For most, the word “Visualization” conjures up images of pie charts, bar and line graphs and pretty pictures. There is more to visualization than pretty pictures. Visualization is the process of transforming raw data into a visual representation that allows for keen insight to the relationships and complexity that exist in the data; this process, with the aide of tools and techniques commonly utilized in computer science, graphics and imaging, gives birth to what is so often casually categorized as “pretty pictures.” Data in its rawest form are large in size, complex in nature, and unstructured in organization. It is the production and generation of enormous amounts of data that drives the need for visualization. Details of the visualization process are beyond the scope of this article; however, visualization allows researchers to view the data at various levels of detail, reveals complex relationships difficult to detect by human visual inspection alone and allows visual representation of expected results and sometimes unexpected discoveries. Visualization leads to “insight” which fosters discoveries while providing explanations to complex problems. The need to diversify a field with such far-reaching influence is imperative.
 The goals of the workshop were to broaden participation of women and underrepresented groups in visualization, to foster a community of current and future scholars with interests in visualization and to encourage participants to consider visualization as a career path. These goals were achieved by meeting the following objectives:
- recruiting women and underrepresented groups
- providing networking and mentoring opportunities
- enabling communication and collaboration
- providing a platform to showcase participant research
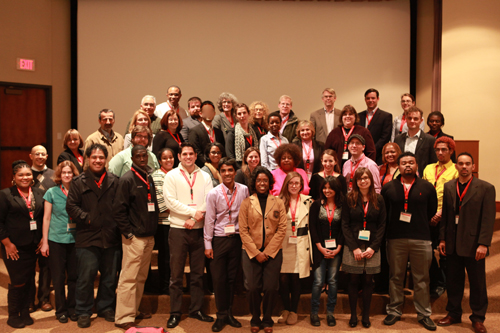
Figure 1. BPViz2014 Workshop Participants, Speakers and Organizers
The workshop opened with “First Impressions.” Participants were asked questions to gauge their knowledge and understanding of visualization; this provided feedback and insight on their expectations for the workshop, i.e., what they hoped to learn or gain from the workshop experience. Knowledge of visualization among participants ranged from beginner to advanced. Similarly, a “Last Impressions” session was scheduled for the end of the workshop where the same participants were asked the same questions to measure whether the workshop had met their expectations.
Participant Participation
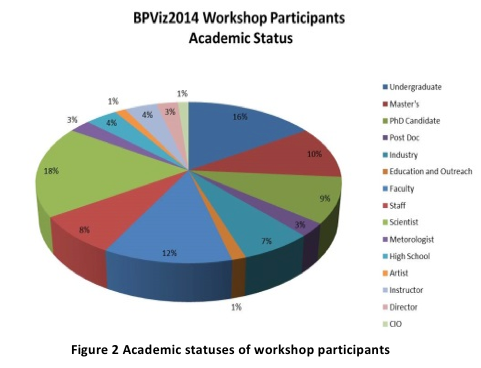 Visualization is multidisciplinary in nature and as such, planning for the workshop took a multidisciplinary approach to recruitment. Special effort was made to reach out to participants at historically black colleges and universities. Participants were recruited via a number of different venues including, but not limited to, submitting requests to post announcements about the workshop on online resources that target women and underrepresented groups: The Anita Borg Institute/Grace Hopper listserv, association listservs, Broadening Participation Communities and discipline-specific mailing lists. To ensure widespread interest in participation considerable effort was made to reach all fields of scholarship where visualization techniques provide insight. Leveraging Clemson University’s leadership in cyberinfrastructure initiatives and commitment to education outreach a nation-wide call for participation was made to cyberinfrastructure stakeholders. The workshop was well received by the visualization community, and its lofty goal of widespread participation was achieved beyond expectations. After a highly competitive selection process, 20% of applicants were selected for funded participation. Over 100 participants were expected to attend. Due to inclement weather conditions, the 2-day workshop was shortened to one full day. A total of 77 participants (45% female; 55% male) were in attendance despite the unexpected snow storm in South Carolina. Participation was well represented all levels of scholarship (Figure 2, above), interests and ethnic backgrounds.
If we are serious about broadening participation in the fields of science, technology, engineering and mathematics (STEM), we must broaden participation at all levels of academia. This workshop included undergraduates, graduate students, post-docs, faculty members, research scientists, members from education outreach community, K-16 instructors, and self-funded participation from K-12 participants (high school juniors, seniors and instructors), and visualization artists.
Networking and Mentoring
Attention was made to ensure academic and industry participation represented a variety of speakers from underrepresented groups and from across disciplines. Respected and leading members of the visualization community from academia and industry with mentoring experience and/or from an underrepresented group were invited to participate in the workshop as speakers and/or panelist. The workshop featured events for networking and mentoring on-site; however, mentoring started before the workshop. A rapport was established with participants via email and heavily utilized to keep participants informed and up-to-date regarding planned workshop events, provide suggestions on how to prepare for workshop sessions, and answer questions for first time workshop attendees. Dr. Nancy Amato, Distinguished ACM Lecturer and one of the keynote speakers for the workshop, graciously gave her time and expertise and provided additional mentoring on-site during the workshop.
Enabling Communication and Collaboration
A variety of speakers and visualization experts from across disciplines where visualization plays an important role were invited to participate in a panel discussion. The panel was representative of workshop participant demographics and consisted of representation from academia, industry, and underrepresented groups. The purpose of the panel was to convey and encourage participants considering career paths to consider visualization while highlighting different paths to visualization and opportunities encountered along the way. The panel consisted of:
- Maxine Brown, Associate Director of the Electronic Visualization Laboratory (EVL) at the University of Illinois at Chicago
- Michael Smith, Visual Media Architect and Academic Program Director with Intel where he leads education program in visualization, high performance computing, parallel programming and mobile computing
- Sophie Jörg and Joshua Levine, Assistant Professors in the Visual Computing Division of the School of Computing at Clemson University
- Alberto Roca, Executive Director of DiverseScholar.org Vetria Byrd, Director of Advanced Visualization at Clemson, Workshop Organizer
- Sussan Einakian, a graduate student at University of Alabama at Huntsville and workshop participant, was invited to participate as a panelist to represent the student perspective.
The panel discussion was followed by a “Meet the Panelist” session. Participants were given the opportunity to meet and talk with panel speakers one-on-one. This proved to be appreciated by all participants but even more so by participants who described themselves as beginners or novices to visualization.
Industry and academic speakers included
- Dr. Nancy Amato, Distinguished ACM Lecturer, Texas A&M University (Day 1 Keynote Address)
- Dr. Donna Cox, Director of Advanced Visualization Laboratory (AVL) at the National Center for Supercomputing Applications (NCSA) (Day 2, Keynote Address)
- Christopher Senesac (Sr. Process and System Architect at Boeing)
- Michael Smith (Visual Media Artist, Intel) Casey Goodlett (R&D Engineer at Kitware, Inc.)
- Benjamin Rennison and Michael Scafuri (Archaeologist and Metrologist, Clemson University Restoration Institute)
Poster/Visualization Showcase
 The highly anticipated poster/visualization showcase was well attended. The session further engaged participants and speakers alike by allowing participants with intermediate/advanced knowledge of visualization to showcase their work while giving beginners an opportunity to converse with others and experts in the field about their visualization interests.
Participants new to visualization were advised to treat the poster session as a conversational piece and embrace the moment for the invaluable experience that it was: a mechanism for initiating conversation with leading experts in the field. How often does this happen for someone new to the field? Poster topics were a wonderful mix of research not only in expected fields like computer science, engineering and biology, but also represented research interests from digital humanities and social media, to wire fraud and air quality.
Posters from the showcase can be viewed at http://citi.clemson.edu/viz/BPViz2014/Showcase/Poster.html.
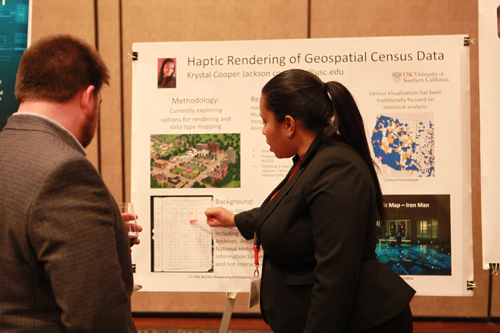
Figure 3 Workshop participant, Krystal Jackson, during Poster/Visualization Showcase
Broadening Participation in STEM through Visualization
The workshop provided diversity in participants, representation of research, and workshop content. Despite inclement weather conditions, the workshop was a success. Visualization incorporates techniques and methods applied and refined in science, technology and engineering fields, and as such the field of visualization is subject to the same diversity deficiencies found in all STEM fields. Feedback from survey responses are still pending, however verbal feedback from participants during the workshop was encouraging. Clemson University is committed to continuing efforts to broaden participation of women and members of underrepresented groups in visualization. Plans are underway for BPViz2015.
About the Author
Dr. Vetria L. Byrd is a Visualization Scientist and Director of Advanced Visualization in Clemson’s Computing and Information Technology, Center for Excellence in Next Generation Computing at Clemson University. As a member of the African American PhDs in Computer Science (AAPHDCS) group, Dr. Byrd has benefited from invaluable mentorship from members of underrepresented groups and shares her positive experiences with undergraduate data visualization interns she mentors at Clemson University. Dr. Byrd will extend her knowledge and expertise to undergraduates who participate in the newly funded NSF REU Site: Research Experiences for Undergraduates in Collaborative Data Visualization Applications June 2, 2014 – July 25, 2014 at Clemson University.
Acknowledgements
This workshop was partially funded by CRA-W/CDC and NSF Grant ACI-1419415. Thank you to everyone who helped with the planning and organization specifically: Jim Bottum, CIO of Clemson Computing and Information Technology; co-organizers: Jill Gemmill, Edward Duffy and Galen Collier, participants and speakers. Special thank you to Simon Appleford and Lori Tanner, they were instrumental in the workshop’s success.


1828 L STREET, NW SUITE 800, WASHINGTON, DC 20036 | P: 202-234-2111 | F: 202-667-1066