On this page, I go over some of the basic tools and terminology used on the project.
Segmentation of Bird Sound
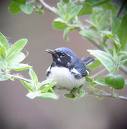
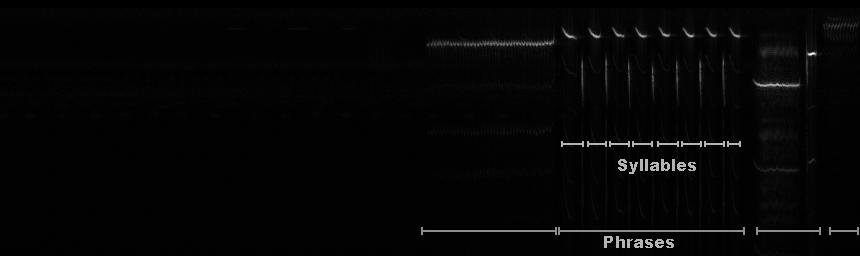
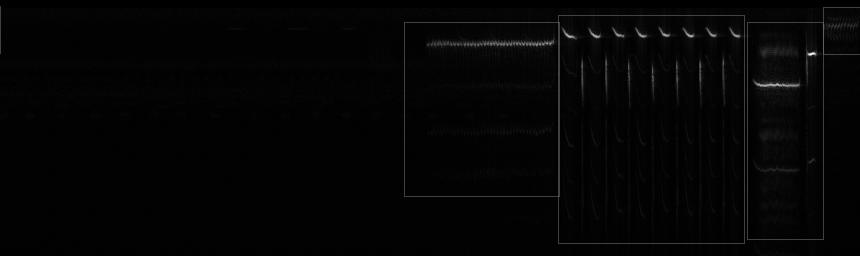
Bird sounds can be divided into phrases, syllables, and elements. Below is the spectrogram of the song
of a Black Throated Blue Warbler (depicted above) that is split up into the phrases, which contain a series
of syllables. Syllables are constructed from elements, but in the case of our research, and in the simple case,
elements and syllables are the same. When a wav file is loaded, a spectrogram (like below) is created. A
spectrogram is a graph of the frequency (x-axis) vs. time (y-axis) of an audio file. In the spectrograms we
are creating, the frequency ranges from high to low as we move up the x-axis, so the higher frequencies are at
the bottom of the image and the lower ones are towards the top.
Here is the short recording from the Cornell Maculauy Library that corresponds to the spectrogram above:
Black Throated Blue Warbler
The goal of my program is to be able to have a user draw rectangles on the spectrogram above, and label
them according to the species. This will allow the ecologists working on the project to label data
that will be used as a training set for the machine learning algorithms. The diagram below is an annotated spectrogram.
The data from the Maculauy Library was collected by those in the field using special microphones aimed at the specific bird.
As can be seen from the week 1 photos of my weekly log, the microphones used in our research sit in the field and pick
up all the surrounding noise. Because of this, there are some issues with the quality of our sound and the amount of background
noise that gets picked up.
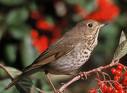
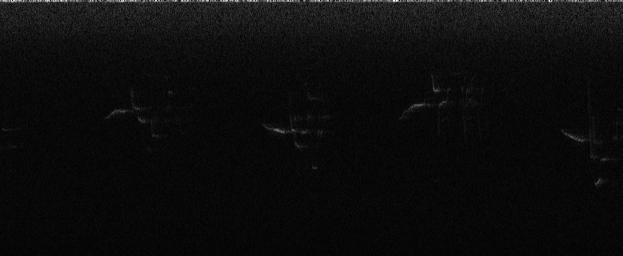
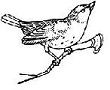
Here is a short recording of a Hermit Thrush (pictured above) from one of the microphones at the Research Forest and the corresponding spectrogram:
Hermit Thrush
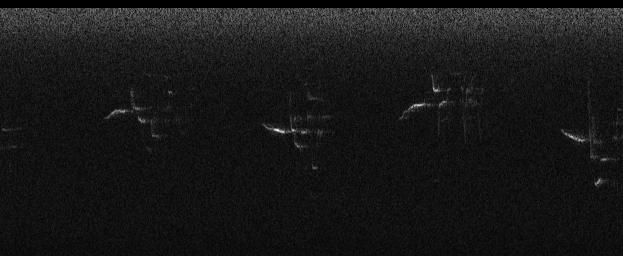
The background noise in the recording accounts for a lot of the salt and pepper on the spectrogram. One of the next steps in
the research is to try and minimize the background noise so that the birds are easier to distinguish. The black bar at the top
of the spectrogram above is one of way that we have minimized some of the noise. By putting in a low bandwidth and by normalizing
we have decreased some of the noise from the stream by getting rid a lot of the louder lower sounds. This allows for the bird noise
to come out more clearly. Below is a spectrogram with no low bandwidth.